Give management discussions shared definitions
Agree on metrics and their sources so departments can align on what the figures mean.

 Not Bad Req(uest)繁中Discuss a project
 Bring scattered data into a consistent business view for management queries, comparisons and investigation.
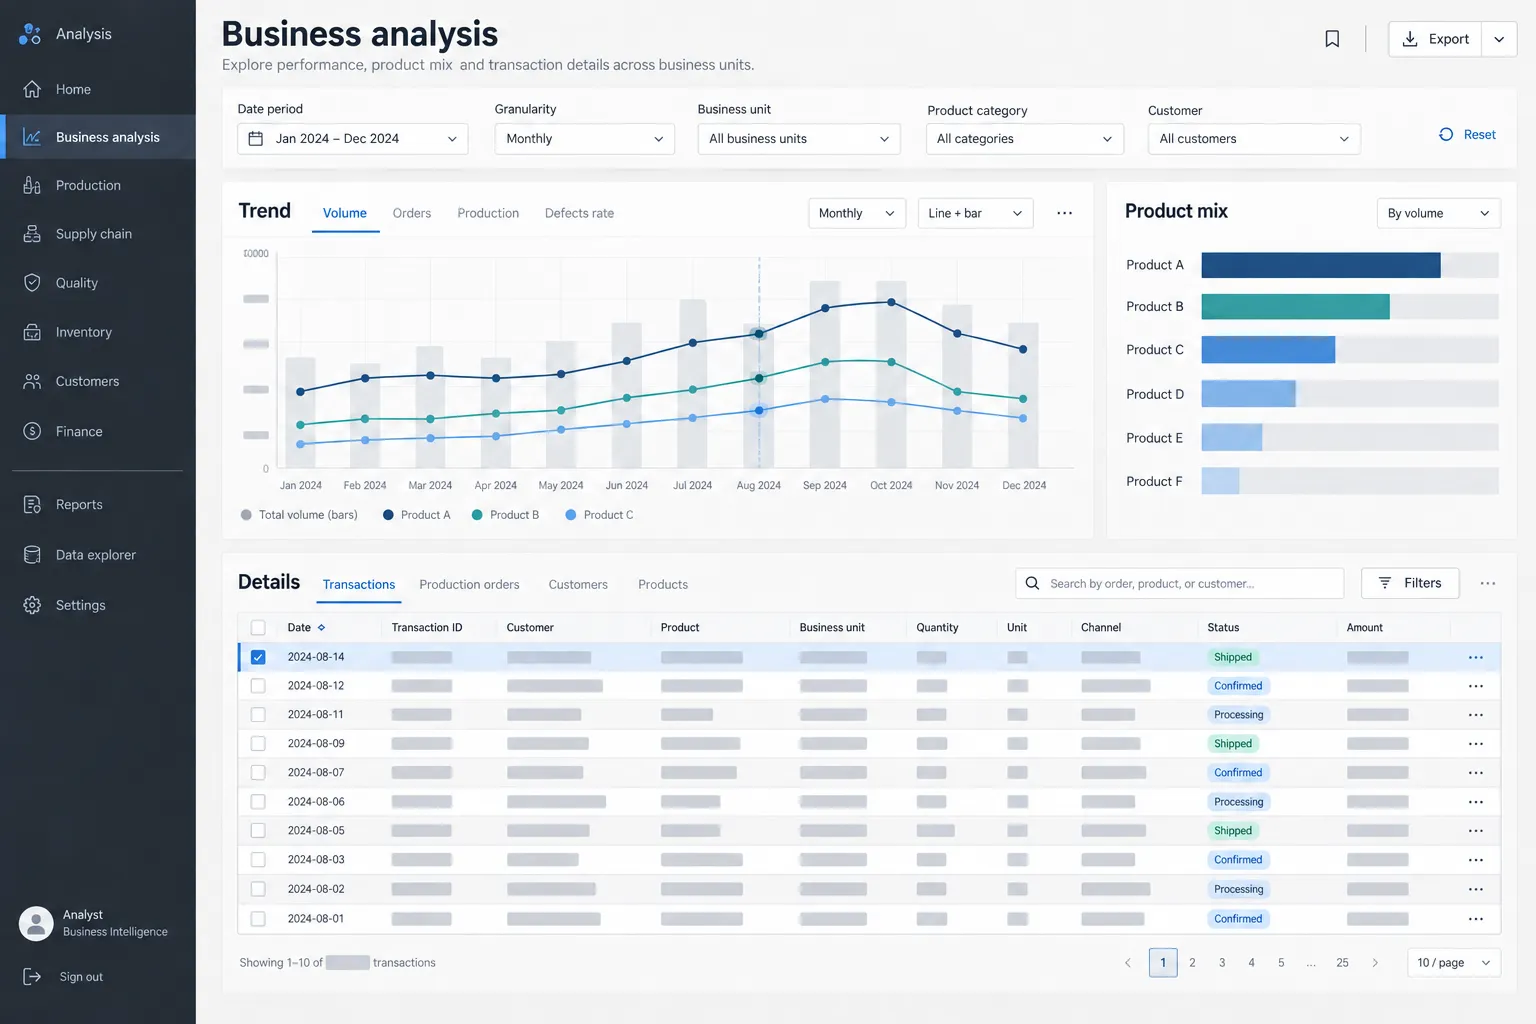
Business analysis workspace with filters, trends and traceable details
Sales, finance and management need to answer different questions from the same operational data: sales trends, financial indicators and overall business performance. When source preparation and metric definitions are handled separately, reports are difficult to compare and the reasons behind the numbers are harder to investigate.
This enterprise collaboration experience covers enterprise data preparation, sales and financial analysis, and interactive management dashboards. Data processing and analysis interfaces supported different roles in reviewing business information.
Enterprise collaboration experience
Agree on metrics and their sources so departments can align on what the figures mean.
Organize trends, comparisons and filters around management questions so readers can investigate causes and discuss concrete actions.
Keep data preparation and metrics reusable so new reports can build on confirmed definitions and sources.
Planning considerations for a similar project; the actual scope follows your data, existing resources and operating requirements.
For similar needs, reuse available data and reporting tools, adding the integration and analysis interfaces required. Update frequency and query scale affect build and operating costs, so the platform should follow decision needs.
Start with one management question, a defined data set and one report. Reconcile figures and definitions, then have decision makers try the filters and comparisons. Confirm that the report answers the question and data can be refreshed as needed before adding metrics and roles, keeping development effort focused on usable analysis.
Choose one management question requiring a decision. Confirm available data and the update schedule, then deliver a report or analysis interface that answers it.
Discuss this directionShare your business need, workflow or product idea. Start with an initial conversation to discuss a suitable scope and next step.
Request a free initial conversation Further analysis and development follow an agreed scope.